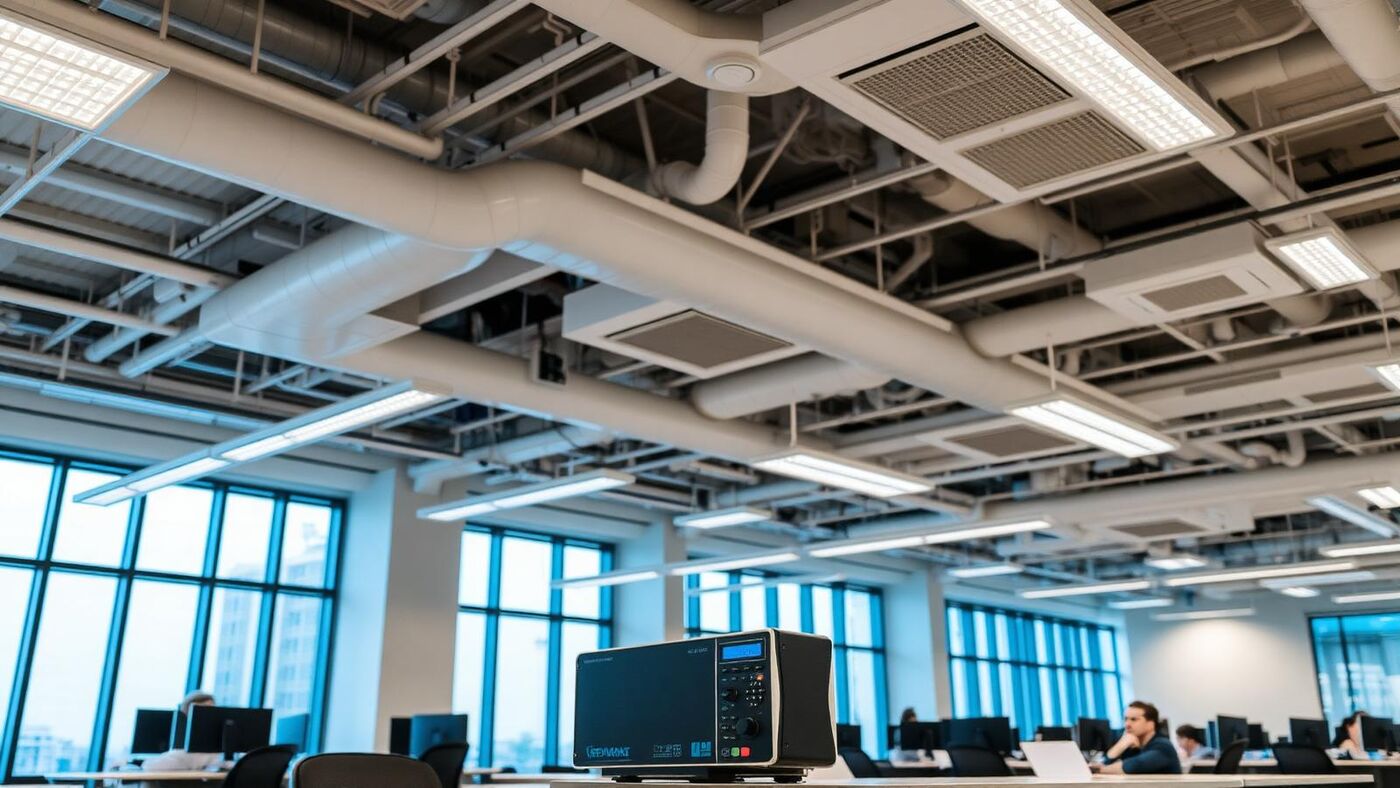
Fresh Air Supply Assessment
Independent ventilation hygiene assessors · Focused on impartial evidence
If rooms feel stuffy or CO₂ readings climb through the day, the question is simple: are people getting enough fresh air? We answer it using CO₂ — the most practical indicator of ventilation relative to occupancy — and show you where and when outdoor air falls short.
Established 1999 · 2,500+ assessments · SafeContractor approved · BOHS Affiliate Member · London & South East
Why CO₂ is used
People exhale CO₂, so indoor CO₂ rises when outdoor-air supply does not keep pace with occupancy. Measured over a working day and compared with outdoor levels, it shows how well each space is ventilated for the number of people using it.
How we assess fresh air supply
- Occupied CO₂ logging in representative rooms and zones through a normal working day
- Indoor–outdoor CO₂ comparison
- CO₂ decay after occupants leave, to estimate the air-change rate of a space
- Review of occupancy patterns, ventilation run times and BMS settings, where information is available
What the results tell you
The report shows which spaces meet recognised benchmarks, which do not, and at what times. Common causes include outdoor-air dampers held closed, ventilation running on reduced settings, time schedules that don't match occupancy, and rooms used by more people than they were designed for.
| Finding | Likely cause | Next step |
|---|---|---|
| CO₂ rises steadily through the day | Outdoor-air supply too low for occupancy | Review ventilation settings and damper positions with your HVAC contractor |
| High CO₂ only in meeting rooms | Room occupancy above design | Adjust room use, ventilation boost or booking limits |
| High CO₂ early in the day | Ventilation start time too late | Adjust time schedule |
| Good CO₂ but complaints continue | Other causes such as temperature, humidity or pollutants | Wider indoor air quality assessment |
Swipe sideways to see the full table →
Limitations and what this assessment cannot tell you
- CO₂ indicates ventilation relative to occupancy; it is not a direct measurement of airflow
- Results reflect occupancy and settings during the survey
- It does not assess ductwork cleanliness or other pollutants — these can be added
What your report includes
- Rooms and zones monitored
- CO₂ graphs for each location through the day
- Comparison with benchmarks and outdoor levels
- Estimated air-change rate where decay tests were run
- Likely causes
- Prioritised actions
Related ventilation hygiene and indoor air quality services
Frequently Asked Questions
Related ventilation hygiene and indoor air quality services
Need Indoor Air Quality Testing?
Get a no-obligation quote. We provide IAQ testing, ventilation assessment and environmental monitoring across London and the South East.