PM2.5 and PM10 Monitoring for Offices
Independent indoor air quality assessors · Since 1999
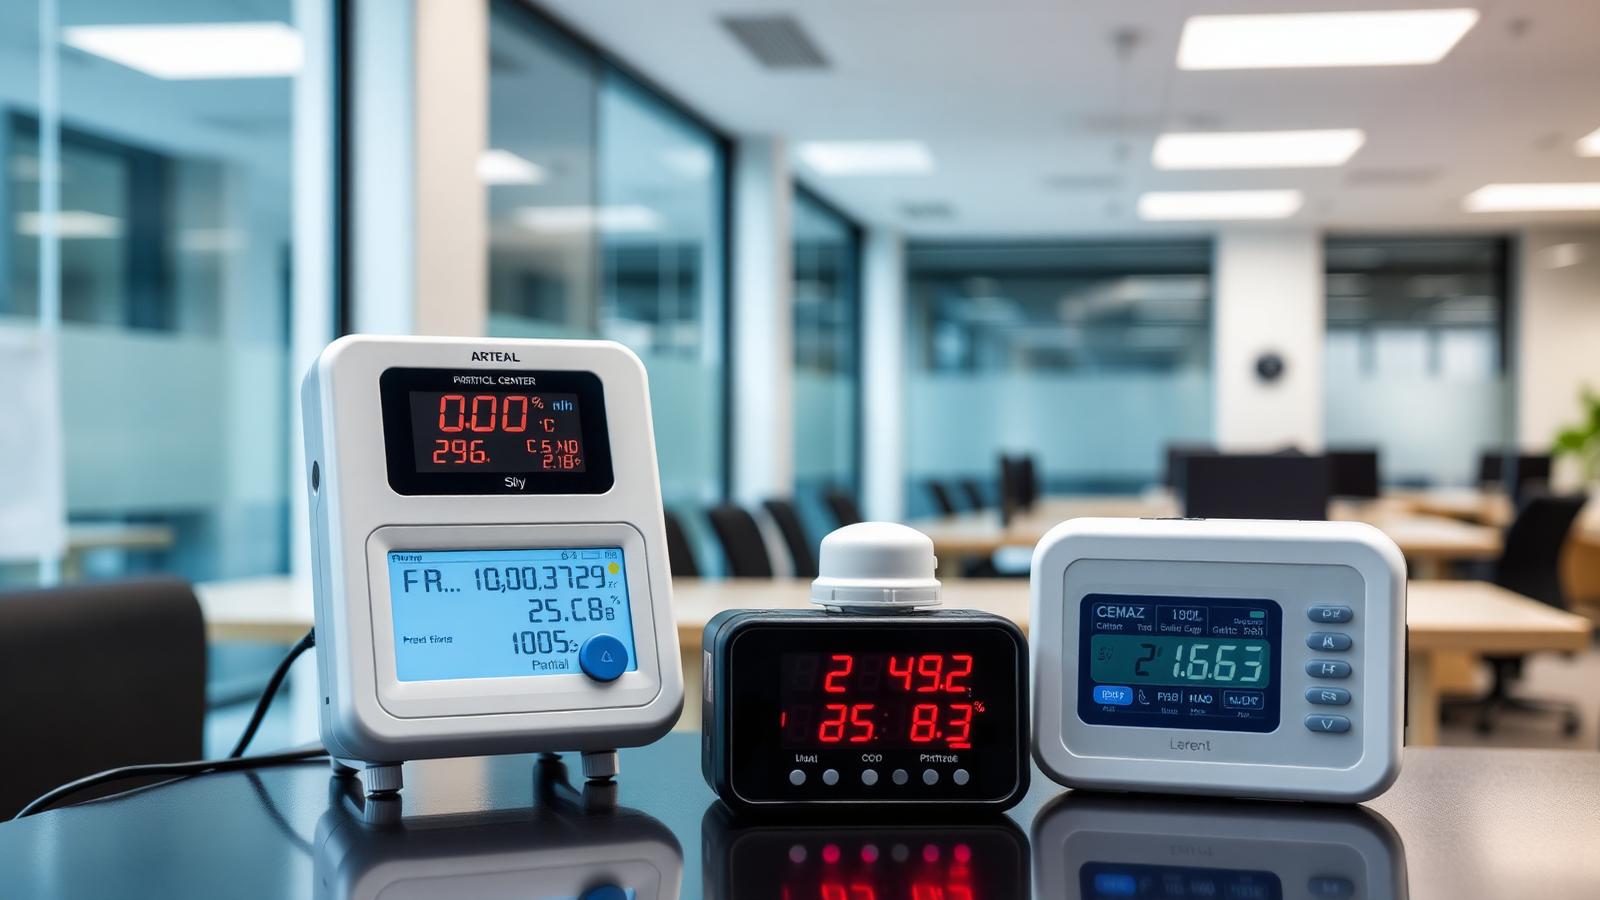
PM2.5 and PM10 monitoring shows how airborne fine and coarse particle fractions change across an occupied office. PM2.5 represents the finer fraction; PM10 includes larger particles as well as finer material. Both can arise outdoors or from indoor activities, and neither reading identifies composition by itself. We use real-time optical instruments to reveal location and time patterns, with gravimetric sampling where a mass-based comparison or project method calls for it. Findings are interpreted against relevant WHO guidance or scheme criteria without confusing office IAQ monitoring with occupational dust exposure.
Established 1999 · 2,500+ assessments · SafeContractor approved · BOHS Affiliate Member · London & South East
What the particle fractions tell you
Particle-size fractions are operational indicators rather than named substances. PM2.5 trends can be influenced by combustion-related outdoor pollution and fine indoor aerosols. PM10 also responds to coarser material from movement, cleaning, textiles, paper and works. The relationship between the two helps describe an event but cannot prove its source. Results need room use, ventilation, activities and outdoor conditions to become useful building evidence.
Indoor and outdoor sources
Outdoor traffic, construction, deliveries and regional episodes can enter through intakes, open windows, doors or leakage. Indoors, cleaning, printers, cooking areas, material handling, refurbishment and resuspension of settled dust may affect readings. A monitoring plan uses representative office zones, likely pathways and a suitable outdoor or intake comparison where feasible. This shows whether rises occur together, remain local to one activity or follow ventilation operation.
Real-time optical monitoring
Optical instruments estimate particulate concentration from how particles scatter light. They provide frequent time-stamped readings that reveal peaks, occupied build-up and differences between locations. We check instrument placement, logging period and relevant quality-control information, then relate graphs to occupancy and activity records. Optical response varies with particle shape, density and moisture, so the report explains its use as a trend and screening method rather than universal laboratory identification.
When gravimetric sampling is appropriate
Gravimetric sampling collects material on a weighed filter and determines mass from the sampled air volume. It may be selected for a specified project method, a mass-based comparison or to support an investigation where optical readings need another evidence line. It does not automatically identify chemical composition. Personal inhalable or respirable dust sampling is a different occupational method and is selected through Workplace Dust Assessment when worker exposure is the question.
Comparison with guidance and scheme criteria
Results can be compared with the WHO indoor air quality context or the criteria in an applicable BREEAM, WELL pre-testing or client brief. We confirm averaging period, method and occupancy assumptions before making a comparison. A scheme may specify its own sampling locations, instrument performance and evidence format. Formal WELL verification remains the role of a WELL Performance Testing Agent; our work can support pre-testing and corrective planning.
Filtration and ingress findings
When patterns suggest a ventilation pathway, accessible filters, seals, housings, intakes and schedules can be reviewed. Indoor-outdoor timing may show likely ingress, while a local indoor peak can point towards an activity or resuspension. Findings give the HVAC contractor focused evidence for mechanical diagnosis. We can repeat monitoring after filter, control or operational changes to check the occupied-space outcome.
Is this the right page?
Use this service for routine or project-specific PM2.5 and PM10 evidence in offices. Indoor Particulate Investigation is for high or unexplained readings requiring source apportionment. Workplace Dust Assessment covers personal COSHH exposure sampling.
Limitations and what this assessment cannot tell you
PM monitoring describes particle-size fractions during the measured period.
- Optical instruments estimate mass and respond differently to different particle types
- PM2.5 and PM10 values do not identify chemical composition
- Indoor-outdoor association supports but does not alone prove a source
- Office area monitoring does not replace personal exposure sampling
- Results depend on averaging period, occupancy, weather and ventilation operation
What the PM monitoring report contains
- Office zones, likely sources and ventilation context
- Instrument method, logging period and quality checks
- PM2.5 and PM10 time-series graphs by location
- Indoor-outdoor and activity comparisons where available
- Relevant WHO or project-criteria interpretation
- Filtration, ingress and follow-up recommendations
Related dust and particulate services
Frequently Asked Questions
Need Indoor Air Quality Testing?
Get a no-obligation quote. We provide IAQ testing, ventilation assessment and environmental monitoring across London and the South East.